
New York Mets at Houston Astros
· Major League Baseball
New York Mets
5-5-1, 3-2-1 Away
Final
5 - 5
5 - 5

Houston Astros
5-3-3, 3-1-2 HomeHow To Watch
How can I watch New York Mets vs. Houston Astros?
- TV Channel: Mets at Astros 2022 MLB Baseball, is broadcasted on MLB.tv.
- Online streaming: Sign up for Fubo.
Scoring Summary
 |
9th Inning | Gonzalez grounded into fielder's choice to third, Price out at third. |
|
9th Inning | Cerny walked, Price to second. |
|
9th Inning | Price singled to center, Matijevic to third. |
|
9th Inning | Matijevic singled to right. |
 |
9th Inning | Courtney relieved Greene |
|
9th Inning | Stubbs homered to left center, Julks scored and Whitaker scored. |
Statistics
 NYM |
 HOU |
|
|---|---|---|
| 1 | Games Played | 1 |
| 1 | Team Games Played | 1 |
| 0 | Hit By Pitch | 1 |
| 0 | Ground Balls | 0 |
| 10 | Strikeouts | 10 |
| 5 | Runs Batted In | 5 |
| 0 | Sacrifice Hit | 0 |
| 10 | Hits | 11 |
| 2 | Stolen Bases | 1 |
| 3 | Walks | 6 |
| 0 | Catcher Interference | 0 |
| 5 | Runs | 5 |
| 1 | Ground Into Double Play | 2 |
| 0 | Sacrifice Flies | 0 |
| 37 | At Bats | 37 |
| 1 | Home Runs | 2 |
| 0 | Grand Slam Home Runs | 0 |
| 14 | Runners Left On Base | 25 |
| 0 | Triples | 0 |
| 0 | Game Winning RBIs | 0 |
| 0 | Intentional Walks | 0 |
| 0 | Doubles | 2 |
| 0 | Fly Balls | 0 |
| 0 | Caught Stealing | 0 |
| 0 | Pitches | 0 |
| 0 | Games Started | 0 |
| 0 | Pinch At Bats | 0 |
| 0 | Pinch Hits | 0 |
| 0.0 | Player Rating | 0.0 |
| 1 | Is Qualified | 1 |
| 1 | Is Qualified In Steals | 1 |
| 13 | Total Bases | 19 |
| 40 | Plate Appearances | 44 |
| 162.0 | Projected Home Runs | 324.0 |
| 1 | Extra Base Hits | 4 |
| 4.4 | Runs Created | 7.4 |
| .270 | Batting Average | .297 |
| .000 | Pinch Hit Average | .000 |
| .351 | Slugging Percentage | .514 |
| .216 | Secondary Average | .405 |
| .325 | On Base Percentage | .409 |
| .676 | OBP Pct + SLG Pct | .923 |
| 0.0 | Ground To Fly Ball Ratio | 0.0 |
| 4.3 | Runs Created Per 27 Outs | 7.2 |
| 35.0 | Batter Rating | 42.0 |
| 37.0 | At Bats Per Home Run | 18.5 |
| 1.00 | Stolen Base Percentage | 1.00 |
| 0.00 | Pitches Per Plate Appearance | 0.00 |
| .081 | Isolated Power | .216 |
| 0.30 | Walk To Strikeout Ratio | 0.60 |
| .075 | Walks Per Plate Appearance | .136 |
| -.054 | Secondary Average Minus Batting Average | .108 |
| 10.0 | Runs Produced | 10.0 |
| 1.0 | Runs Ratio | 1.0 |
| 0.4 | Patience Ratio | 0.6 |
| 0.3 | Balls In Play Average | 0.4 |
| 84.0 | MLB Rating | 92.0 |
| 0.0 | Offensive Wins Above Replacement | 0.0 |
| 0.0 | Wins Above Replacement | 0.0 |
Game Information
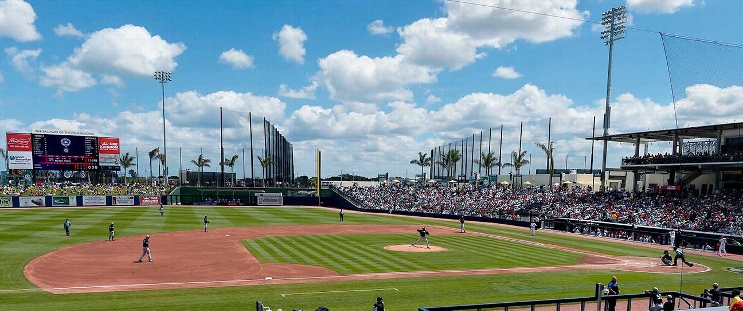
CACTI Park of the Palm Beaches
Location: Palm Beach, Florida
Attendance: 4,088 | Capacity:
2026 National League East Standings
| TEAM | W | L | PCT | GB | STRK |
|---|---|---|---|---|---|
 Atlanta |
- | 68 | L1 | 0.5802469 | 94 |
 Philadelphia |
6 | 74 | W1 | 0.54320985 | 88 |
 Miami |
14 | 82 | W1 | 0.49382716 | 80 |
 Washington |
17 | 85 | W1 | 0.47530866 | 77 |
| New York |
20 | 88 | L1 | 0.45679012 | 74 |
2026 American League West Standings
| TEAM | W | L | PCT | GB | STRK |
|---|---|---|---|---|---|
| Houston |
- | 81 | W2 | 0.5 | 81 |
 Texas |
1 | 82 | L1 | 0.49382716 | 80 |
 Seattle |
5 | 86 | W2 | 0.4691358 | 76 |
 Athletics |
17 | 98 | L2 | 0.39506173 | 64 |
 Los Angeles |
19 | 100 | L2 | 0.38271606 | 62 |