Washington Capitals at Nashville Predators
· National Hockey League

Regular Season Series
WSH wins series 2-0
Scoring Summary
 |
Goal | 1st Period 4:17 | |
 |
Goal | 3rd Period 2:43 | |
|
Goal | 3rd Period 3:27 | |
|
Goal | 3rd Period 4:33 | |
|
Goal | 3rd Period 18:37 |
Statistics
 WSH |
 NSH |
|
|---|---|---|
| 17 | Blocked Shots | 9 |
| 21 | Hits | 37 |
| 3 | Takeaways | 7 |
| 28 | Shots | 34 |
| 1 | Power Play Goals | 0 |
| 4 | Power Play Opportunities | 2 |
| 25.0 | Power Play Percentage | 0.0 |
| 0 | Short Handed Goals | 0 |
| 0 | Shootout Goals | 0 |
| 28 | Faceoffs Won | 34 |
| 45.2 | Faceoff Win Percent | 54.8 |
| 7 | Giveaways | 9 |
| 2 | Total Penalties | 5 |
| 4 | Penalty Minutes | 8 |
 Nashville Predators Injuries
| NAME, POS | STATUS | DATE |
|---|---|---|
| Jonathan Marchessault, RW | Day-To-Day | Nov 14 |
 Washington Capitals Injuries
| NAME, POS | STATUS | DATE |
|---|---|---|
| Rasmus Sandin, D | Injured Reserve | Nov 9 |
| Vincent Desharnais, D | Injured Reserve | Oct 23 |
Game Information
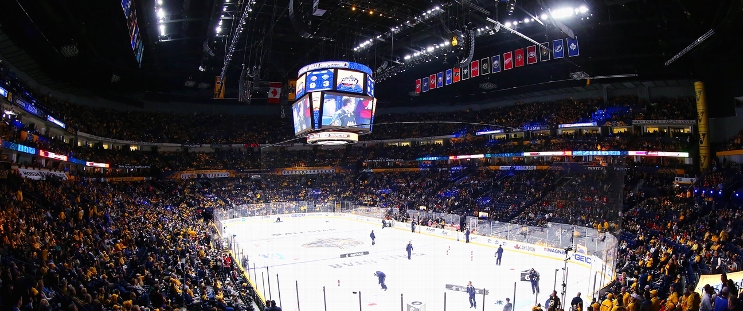 Bridgestone Arena
Location: Nashville, TN
Attendance: 17,238 | Capacity:
Bridgestone Arena
Location: Nashville, TN
Attendance: 17,238 | Capacity:
2026-27 Metropolitan Division Standings
| TEAM | W | L | PTS | OTL |
|---|---|---|---|---|
 Carolina |
2 | 3 | 34 | 16 |
 New Jersey |
0 | 6 | 30 | 15 |
 NY Rangers |
1 | 8 | 25 | 12 |
 NY Islanders |
4 | 6 | 22 | 9 |
 Washington |
0 | 8 | 20 | 10 |
 Philadelphia |
6 | 10 | 18 | 6 |
 Pittsburgh |
2 | 11 | 16 | 7 |
 Columbus |
0 | 11 | 14 | 7 |
Full Standings