
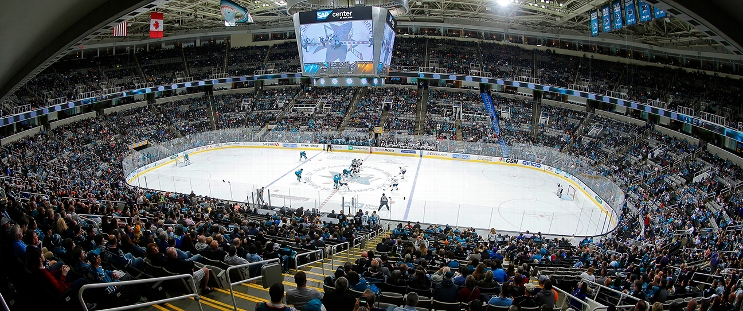
Chicago Blackhawks at San Jose Sharks
· National Hockey League

Regular Season Series
Series starts 1/30
Statistics
 CHI |
 SJ |
|
|---|---|---|
| 3.79 | Goals Against Average | 3.40 |
| 30.4 | Shots Against per Game | 31.0 |
| 79.5 | Penalty Kill Percentage | 84.0 |
| 9 | Power Play Goals Against | 8 |
| 0 | Short Handed Goals Against | 0 |
| 2.21 | Goals For per Game | 2.67 |
| 23.0 | Shots per Game | 27.1 |
| 5 | Power Play Goals | 12 |
| 11.6 | Power Play Percentage | 23.1 |
| 1 | Short Handed Goals | 4 |
| 124 | Penalty Minutes | 159 |
 San Jose Sharks Injuries
| NAME, POS | STATUS | DATE |
|---|---|---|
| Igor Chernyshov, LW | Injured Reserve | Oct 28 |
| Alexander Wennberg, C | Injured Reserve | Oct 28 |
| Quentin Musty, LW | Injured Reserve | Sep 28 |
| Kyle Keyser, G | Injured Reserve | Sep 28 |
 Chicago Blackhawks Injuries
| NAME, POS | STATUS | DATE |
|---|---|---|
| Bowen Byram, D | Out | Oct 31 |
















 MTL
 FLA
 DET
 BOS
 OTT
 BUF