
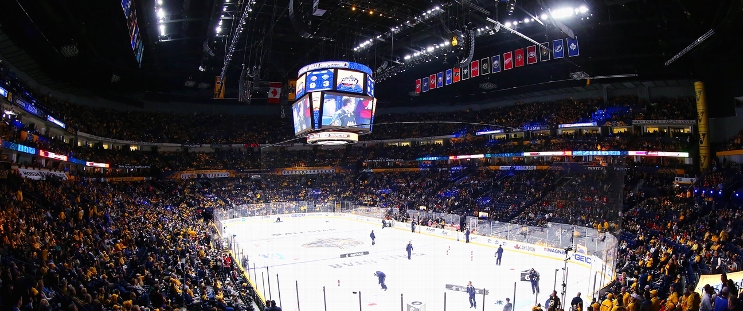
Los Angeles Kings at Nashville Predators
· National Hockey League

Regular Season Series
Series starts 11/10
Statistics
 LA |
 NSH |
|
|---|---|---|
| 3.46 | Goals Against Average | 3.14 |
| 28.3 | Shots Against per Game | 28.9 |
| 62.5 | Penalty Kill Percentage | 88.9 |
| 15 | Power Play Goals Against | 5 |
| 0 | Short Handed Goals Against | 0 |
| 2.77 | Goals For per Game | 2.93 |
| 28.0 | Shots per Game | 26.2 |
| 8 | Power Play Goals | 15 |
| 17.8 | Power Play Percentage | 31.9 |
| 2 | Short Handed Goals | 2 |
| 139 | Penalty Minutes | 102 |
 Nashville Predators Injuries
| NAME, POS | STATUS | DATE |
|---|
 Los Angeles Kings Injuries
| NAME, POS | STATUS | DATE |
|---|---|---|
| Adrian Kempe, RW | Day-To-Day | Nov 1 |
| Mats Zuccarello, RW | Injured Reserve | Oct 29 |
| Kevin Fiala, LW | Injured Reserve | Oct 29 |
| Alex Turcotte, C | Injured Reserve | Oct 10 |
| Jakub Dvorak, D | Injured Reserve | Sep 24 |
















 NJ
 NYR
 OTT
 BUF
 PIT
 NYI
 WSH
 TB