
Carolina Hurricanes at San Jose Sharks
· National Hockey League

Regular Season Series
Series starts 2/25
Statistics
 CAR |
 SJ |
|
|---|---|---|
| 2.19 | Goals Against Average | 3.40 |
| 22.4 | Shots Against per Game | 31.0 |
| 83.3 | Penalty Kill Percentage | 84.0 |
| 9 | Power Play Goals Against | 8 |
| 0 | Short Handed Goals Against | 0 |
| 3.94 | Goals For per Game | 2.67 |
| 33.1 | Shots per Game | 27.1 |
| 14 | Power Play Goals | 12 |
| 24.1 | Power Play Percentage | 23.1 |
| 3 | Short Handed Goals | 4 |
| 142 | Penalty Minutes | 159 |
 San Jose Sharks Injuries
| NAME, POS | STATUS | DATE |
|---|---|---|
| Igor Chernyshov, LW | Injured Reserve | Oct 28 |
| Alexander Wennberg, C | Injured Reserve | Oct 28 |
| Quentin Musty, LW | Injured Reserve | Sep 28 |
| Kyle Keyser, G | Injured Reserve | Sep 28 |
 Carolina Hurricanes Injuries
| NAME, POS | STATUS | DATE |
|---|---|---|
| Taylor Hall, LW | Day-To-Day | Nov 2 |
| Alexander Nikishin, D | Out | Oct 26 |
| Jordan Staal, C | Injured Reserve | Oct 15 |
Game Information
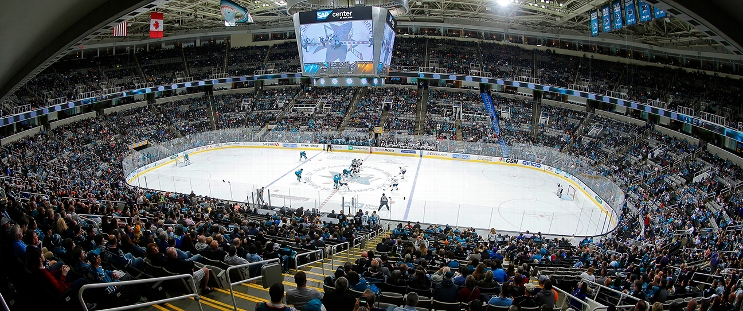 SAP Center at San Jose
Location: San Jose, CA
Capacity:
SAP Center at San Jose
Location: San Jose, CA
Capacity:
2026-27 Metropolitan Division Standings
| TEAM | W | L | PTS | OTL |
|---|---|---|---|---|
 Carolina |
2 | 2 | 26 | 12 |
 New Jersey |
0 | 5 | 18 | 9 |
 Washington |
0 | 5 | 16 | 8 |
 NY Islanders |
2 | 5 | 16 | 7 |
 NY Rangers |
1 | 7 | 15 | 7 |
 Pittsburgh |
2 | 7 | 12 | 5 |
 Philadelphia |
4 | 8 | 12 | 4 |
 Columbus |
0 | 7 | 10 | 5 |
Full Standings








 STL
 BOS
 WPG
 OTT
 BUF