
Philadelphia Flyers at Tampa Bay Lightning
· National Hockey League

Regular Season Series
TB leads series 1-0
Statistics
 PHI |
 TB |
|
|---|---|---|
| 3.31 | Goals Against Average | 3.23 |
| 29.8 | Shots Against per Game | 24.9 |
| 80.0 | Penalty Kill Percentage | 77.1 |
| 11 | Power Play Goals Against | 8 |
| 0 | Short Handed Goals Against | 0 |
| 2.19 | Goals For per Game | 3.69 |
| 23.3 | Shots per Game | 30.1 |
| 8 | Power Play Goals | 7 |
| 15.7 | Power Play Percentage | 15.2 |
| 1 | Short Handed Goals | 0 |
| 156 | Penalty Minutes | 102 |
 Tampa Bay Lightning Injuries
| NAME, POS | STATUS | DATE |
|---|---|---|
| Zemgus Girgensons, C | Out | Nov 2 |
| Erik Cernak, D | Day-To-Day | Nov 1 |
| Yanni Gourde, C | Injured Reserve | Sep 28 |
 Philadelphia Flyers Injuries
| NAME, POS | STATUS | DATE |
|---|---|---|
| Rasmus Ristolainen, D | Injured Reserve | Oct 27 |
| Nikita Grebenkin, RW | Injured Reserve | Oct 10 |
Game Information
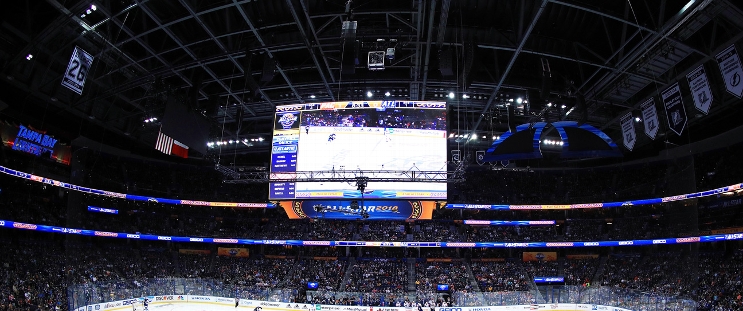 Benchmark International Arena
Location: Tampa, FL
Capacity:
Benchmark International Arena
Location: Tampa, FL
Capacity:
2026-27 Metropolitan Division Standings
| TEAM | W | L | PTS | OTL |
|---|---|---|---|---|
 Carolina |
2 | 2 | 26 | 12 |
 New Jersey |
0 | 5 | 18 | 9 |
 Washington |
0 | 5 | 16 | 8 |
 NY Islanders |
2 | 5 | 16 | 7 |
 NY Rangers |
1 | 7 | 15 | 7 |
 Pittsburgh |
2 | 7 | 12 | 5 |
 Philadelphia |
4 | 8 | 12 | 4 |
 Columbus |
0 | 7 | 10 | 5 |
Full Standings








 ANA
 UTA
 VGK
 COL
 WPG
 NSH