
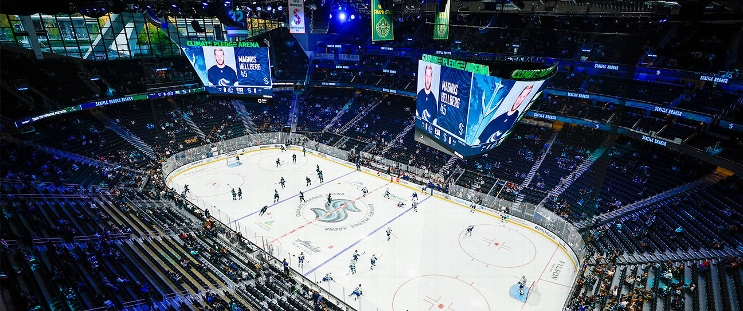
Utah Mammoth at Seattle Kraken
· National Hockey League

Regular Season Series
SEA leads series 1-0
Statistics
 UTA |
 SEA |
|
|---|---|---|
| 3.47 | Goals Against Average | 3.71 |
| 24.5 | Shots Against per Game | 30.8 |
| 68.8 | Penalty Kill Percentage | 64.1 |
| 15 | Power Play Goals Against | 14 |
| 0 | Short Handed Goals Against | 0 |
| 3.60 | Goals For per Game | 3.57 |
| 29.9 | Shots per Game | 25.2 |
| 18 | Power Play Goals | 11 |
| 34.6 | Power Play Percentage | 22.9 |
| 1 | Short Handed Goals | 0 |
| 169 | Penalty Minutes | 148 |
 Seattle Kraken Injuries
| NAME, POS | STATUS | DATE |
|---|---|---|
| Jared McCann, LW | Injured Reserve | Oct 25 |
| Jacob Melanson, RW | Injured Reserve | Oct 10 |
| Ryan Lindgren, D | Injured Reserve | Oct 8 |
| Jake O'Brien, C | Injured Reserve | Sep 30 |
 Utah Mammoth Injuries
| NAME, POS | STATUS | DATE |
|---|---|---|
| Kailer Yamamoto, RW | Day-To-Day | Nov 2 |
| John Marino, D | Injured Reserve | Nov 1 |
| Maveric Lamoureux, D | Injured Reserve | Sep 28 |
















 TB
 PIT
 PHI
 DET
 TOR